
Announcing the BLMK Interactive Neighbourhood Data Dashboard
Click here to visit the dashboard
The Interactive neighbourhood dashboard tool for BLMK neighbourhoods is now live!
This is a public dashboard and does not need a Power BI licence to use, so please do share with anyone who may find it useful.
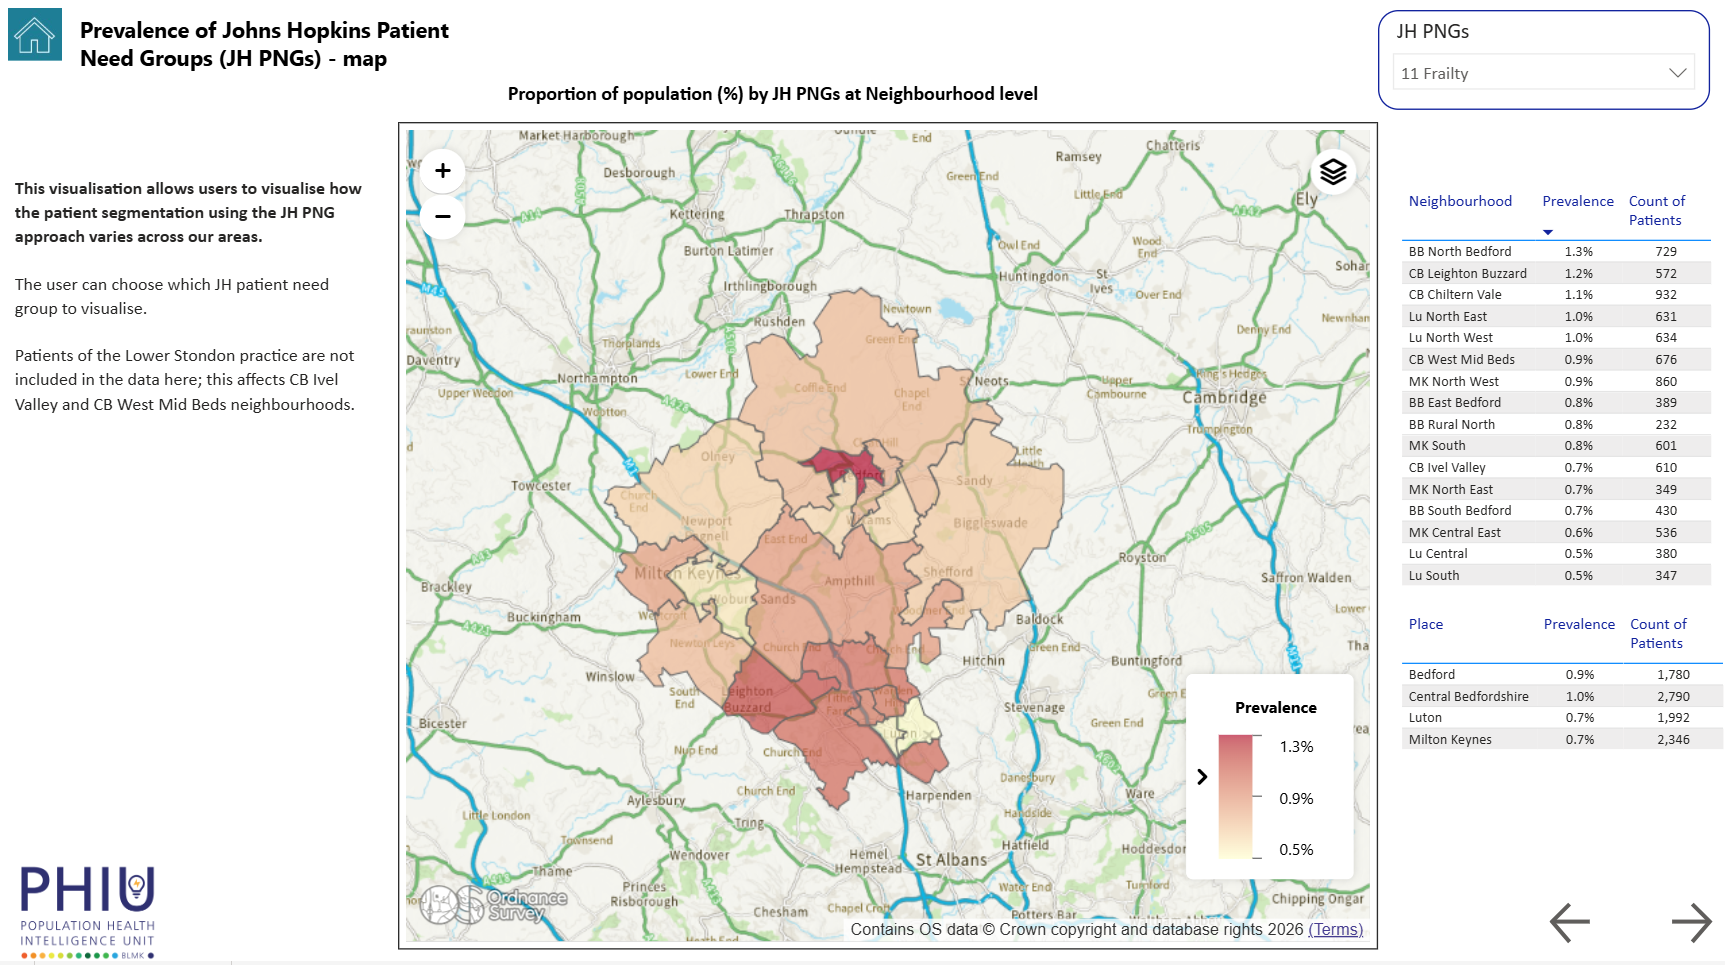
The dashboard has been updated with the agreed neighbourhood boundaries (based on residence) and with data to the end of the financial year 2025/26. It does not include any person-level data and identification of individuals is not possible. If you need to reidentify groups of people there are alternative ways to do this; please get in touch if you need to do this.
Please do read the ‘Introduction’ to understand how the tool works and some of the limitations.
The dashboard allows users to look at a wide range of information, including:
-
Demographics of each neighbourhood
-
Prevalence of long-term conditions
-
Population segmentation using the Johns Hopkins approach
-
Emergency admissions over time, and High Intensity Users of A&E
-
All-cause mortality
Life Expectancy at neighbourhood level and data on obesity, physical activity, self-rated health and disability are still to come.
Any questions or suggestions for improvement are very welcome, please send them through to [email protected].